Wednesday, 9 January 2019

ITS ALL ABOUT PICKING : SAP EWM view


In general, a warehouse and its contents are of no value, rather a major cost driver.
Its main purpose is to provide time and place utility to satisfy customer needs. Without the need for time and place utility a warehouse is of no purpose.
To provide time and place utility one of the fundamental aspect relates to efficacy, efficacy of picking, packing, labeling and shipment on time and in full of the correct ordered goods.
A high-volume warehouse will have many Transportation Units (TU) arriving throughout the day to load and deliver. These TU are of different size and will load packed boxes and pallets for delivery to different routes: deport for export, or from cross dock and de-consolidation or direct delivery.

This implies that the warehouse must synchronize picking so that goods are available with agreed loading time frame, correctly packed and labelled for loading.

From SAP perspective the key processes are as follows:
·         Sales orders are generated for customer to provide specific products at a desired date. Normally different order types are created to deal with exports, domestic ect..for ship to parties that are on a specific route. The sales order may have item quantities that may be defined as items, box or pallets. The sales order may contain specific batches or may contain a batch search strategy to determine ideal batches. The confirmed dates with respect to availability validate available qty and delivery date that is theoretical (rarely takes into consideration supply chain and warehouse issue)
·         Other types of outbound are triggered by stock transfer order for inter plant transfer. Quantities may be optimized based on type of planning system used of simply derived by MRP
·         Deliveries for the respective sales orders are then created based on available warehouse stock. Delivery creation considers the warehouse as block box: indifferent of availability single items, boxes and cartons, indifferent of the transportation unit capacity (possible up to a point if APO Transportation load Builder) , indifferent of load optimization or load sequencing
Deliveries are the key enables for commencing EWM warehouse picking operations. Different type of deliveries will determine if for cross plant transfer, domestic or export. In high volume warehouse picking by deliveries not an option. This will result in in operational delay, confusion and inefficiencies.

The ideal operational process flow is to ensure operational efficiency. This is done as follows:

ASSIGNMENT OF DELIVERIES TO SHIPMENTS
1.      Collect all the deliveries and assign to a Transportation unit. Each transportation unit represent a specific vehicle.

Normally all organization negotiate with shipping agent’s shipment service which include type of vehicle and route schedule. Each transportation unit will be responsible for delivering according to specific route and loading volume is approximated. This can be done via the following functionality:

o   In ERP to limited extent. No truck load optimization is possible load sequencing. Shipment creation allows selection and deliveries to be included with following selection criteria:

Delivery selection

Transportation criteria
Once created system generates shipment document with assigned deliveries

Shipment document is then replicated to EWM by means of IDOC which in turn creates a Transportation unit with assigned deliveries.
The above creation limitation does not have any form of load optimization and delivery grouping simplistically grouped.

o   Creation of Transportation unit in the EWM system. This is possible from shipping cockpit functionality that displays all the deliveries, planner then selects deliveries to be grouped in newly created TU.

Shipment cockpit via transaction NBWC (not part of SAP GUI transactions)

Deliveries displayed in cockpit

Transportation Unit creation criteria

Created Transportation unit with assigned deliveries. The transportation unit are not optimized in terms delivery route and load optimization.

o   Manually create Transportation Unit via transaction /SCWM/TU and assign deliveries.

TU creation criteria

Assign deliveries

Created TU with assigned deliveries

o   Alternative way via third party solution. This implies sending delivery documents via IDOC or other to external system that manages routing and load optimization. This third-party software will then have grouped deliveries in unique shipping units that are optimized by route and are loading volume optimized. These shipping units with assigned deliveries, product and qty are then interfaced (custom) ideally into EWM system by creating a Transportation Unit with assigned deliveries in the EWM system. Possible vendor : https://ortec.com/

Note: in all cases it possible to split deliveries across multiple TU due to load optimization and constraints.
Up to this process step SAP functionality has all the capabilities to create shipment but not perfectly optimized unless third party tool is used.
Depending on the business complexity with respect to delivery route management and load optimization it may be the standard offering within SAP and EWM may be adequate with a simple enhancement if needed.
Once we have the TU with assigned deliveries EWM can then really earn its value by triggering the follow-on step. This where EWM has all the functionality to carry-out effective and efficient picking and shipment.

At this point we have in the system many TU but it does not mean that the warehouse items are ideally stocked. TU are now structured as follows:

TU per vehicle and has expected planned date and time (approximate)

Deliveries
Deliveries may allow for peace’s, carton, packs a and pallet. Also, it may be that pallets are stored in high bay warehouse where some form of FEFO logic is needed.
EWM offers replenishment that can either based on min levels or order-based replenishment. The selection of how to manage the replenishment criteria depends has pros and cons.

Important to note that both methods trigger replenishment activities that may not be completed on time to satisfy TU:
·         Planned replenishment check all stock levels and is indifferent to outbound requirements. Limit this to single peace picking areas such a vertical carousel or pick to lite systems
·         Order based considers deliveries and is indifferent to planned shipments
·         Ideally order based should be based on planned TU, but TU is not part of selection criteria

Moving on:
PRE PLANNING THE SHIPMENTS
Once the TU are in place with expected date and time carry-out the following steps:

        Yard management. 
      This is an optional process, dependency is based on complexity, volume of vehicles and control that is required. Yard functionality to be used for check in of vehicle, weighing, sealing and check-out

                                                          Functions related to yard mgt

Shipping cockpit assign door

In the shipping cockpit

Assign door. This will be the door TU will arrive to be loaded. Important to setup goods issue bins to relevant door. This is fundamental for warehouse task such that pick destination bin displays goods issue bin associated to bin.

Staging bay door relationship.
Shipping cockpit the clearly displays that TU assigned to door

TU visibility and status of door assignment.

 Assignment of the door to TU automatically assigns door to delivery.
At this point in time may be necessary to modify TU date and time. Note: if this is done once picking is started then WO date are not adjusted therefore enhancement is required. This is fundamental to re-sequencing WO picking which is based on system guided picking.

       Assign wave. Once door is assigned assign wave to the TU. Wave creation will then trigger picking and this is where efficacy is gained in that picking managed because automated. Even is not all warehouse are created, planned job (say every 10 minutes) will re-release the wave to create any outstanding picks.


Wave can either be manually assigned or automatically. Once wave is created depending on type of release warehouse tasks are created where picking strategies are successful.

Possible option is to create wave that are not released: this will then require further step within the cockpit to release the wave. Decision of not releasing wave on creation depends on timing and pick volumes. Create wave not released enables replenishment to already consider these TU that have wave assigned but not yet started. Release the wave within narrow window to trigger picking.


It is now fundamental to set-up replenishment to run based on orders but with wave template defined. This implies that deliveries are selected that are assigned to TU and have specific wave template assigned. Consider enhancement to sort deliveries for replenishment based on TU sequence. This ensure that replenishment tasks sequenced accordingly.
Further enhancement is required to consider batch search strategies associated to outbound delivery must be considered when carry-out replenishment. No use having replenishment for batches that do not fit batch search strategy.
Further enhancement is needed if there is a need for multi-level replenishment: pallet > carton>peace’s.
Very important: activate wave mgt for replenishment, this is fundamental to automate steps and avoids excessive human effort. Operator effort purely manage exception where Ware task creation fails.
       Carry-out picking. Wave release will trigger warehouse tasks creation. Efficacy all depends on smart pick strategies are defined. Wave via background job will automatically be released in background to create any missing warehouse tasks due to replenishment tasks running in background. Warehouse order creation rules, queue assignment is fundamental to ensure warehouse order efficacy. This is to ensure that picking tasks are assigned to correct type of resource.


Warehouse order, associated to wave, queue with assigned warehouse tasks. Sequencing of WO must correspond to TU sequencing. This to ensure that when relevant truck arrives products are ready to be loaded.

99% picking activity either carried out via RF, automated crane system, pick to lite, voice pick. the remaining 1% managed manually only for exception. High number manual process confirms badly designed signed.
5.       Labeling
Once picking commences labels are needed. Normally if full pallet picking is carried, re-use of existing HU may be possible. It may that customer specific labels may be needed. Mass printing of labels will be disastrous for any warehouse operation. Labels need to be printed on demand associated to resource that is doing the picking.  This why small label printers attached to belts of RF operator or fork lift trucks will ensure correct label for correct item that is picked.

         Documentation
Many EWM implementations carry-out the usual error by printing delivery notes and packing list from ERP system instead of EWM. This causes all sort of problem in that there is dependency for goods issue to be carried out in ERP to print documentation. Ideal solution is to print documentation from EWM system rather than ERP system.

  Loading
EWM offers the ability to create loading WT, important to understand need for this kind of detail. It may result in unnecessary system effort. Simply update by updating loading in TU to indicate loading complete. Loading complete status can be used to automatically trigger printing of delivery note and packing lists.

  Close shipment
This tasks is needed to free-up door and indicate completion of TU activity.

There may be requirement to update seal number, this may be done at TU level and vehicle level as well as update from weighing station.
Departure from checkpoint then closes the TU and is further critical event to trigger update to ERP system of the TU so that shipment is created and if necessary shipping cost generated.  

Conclusion
 In any warehouse the real value is picking. Warehousing and shipment process to satisfy time and place utility which generates income (billing). Therefore, efficacy within warehousing solution is critical:
·         Efficacy in system operation
·         Efficacy in actual warehouse operation by resource.


Thursday, 27 September 2018

Why bother with SAP IBP for Demand Planning ?

After nearly 20 years of APO DP organization have alternative from SAP; SAP IBP for Demand
Many organizations have already implemented APO DP or third party Demand Planning tools.  Many opted for third party Demand Planning so called best of breed tools.

Overview APO Demand Planning

DP form part of the APO SCM suite that was launched nearly 20 years ago.
Simply stated setting up APO DP requires substantial effort not only to define characteristics that are planned but the all the relevant key figure , info objects, planning  area planning books and data views. This effort also due to technological constraints;  available technology 20 years ago. To support all this set-up complex macros are required for data calculation and how data is viewed. Basic data views such as waterfall report require major set-up and job sequencing.
Once this was done and handed over usability became a problem whereby planners  still used the good old excel to massage data or totally ignored the DP solution basically copied data from excel into one of the data views.
One major advantage offered by APO DP relates to release of forecast to the SNP (Supply network planning)  and PPDS (Production Planning and Detailed Scheduling) without the need of interfaces which are needed for third party demand planning tools.
Planner using DP are heavily dependent on back -office for any variation or flexibility wrt to data views, data processing.
Data integration required complex ‘BW’ type update from ERP system to the APO system in order to get source data.
With all its positive and negative factors organizations were able to generate decent forecast accuracy.

APO Moving On

SAP has now released an OSS note 2456834 – Transition Guide for SAP APO stating that “SAP APO is partially succeeded by two products: SAP S/4 HANA and SAP Integrated Business Planning (SAP IBP)”. SAP APO will be under general support till 2025 (extended from 2020 earlier) part of SAP Business Suite. Currently SCM 7 EhP 3 is most recent Enhancement Package for APO, there is no guidance for EhP 4 or any future enhancement packs for SCM or APO.
APO has mainly 4 sub-modules – DP. SNP. GATP and PPDS. Below figure shows the high-level functionalities of each sub-module and SAP’s roadmap for these functionalities to the successor products. DP and SNP will be succeeded by IBP, GATP & PPDS will be succeeded by similar functionalities in S/4HANA.


IBP is a cloud application and AATP is a new name for functionalities of GATP in S/4HANA. Architecture, configurations, user interface for IBP and AATP are very different w.r.t APO .Hence, transition to successor products should be through new configurations i.e existing APO configurations can not be reused for IBP and AATP in S/4HANA. SAP has also clearly stated in the note that “An automated migration from SAP APO to the successor products is not possible“.
It is also now apparent that the future SAP landscape for customers using APO DP and SNP will need to be Hybrid i.e a mix of On-premise (Core ERP or S/4HANA) and Cloud (IBP).
IBP has been launched few years and many customers have started using it or migrated to it. PPDS has been merged in 1610 release of S/4HANA.Some parts of APO GATP have been made available in 1610 release of S/4HANA and SAP has also provided a road map for AATP as depicted in below figure.


Rule-based ATP (RBA) with substitution functionality of GATP is used by several customers, however, that is not yet available in AATP of S/4HANA. The first version of RBA is expected in 1808 release of S/4HANA.
As of now, APO functionalities are partially available in its successor products S/4HANA and IBP. We need to wait and watch when APO can be fully migrated to S/4HANA and IBP. However, it is very clear now that SAP is recommending to plan for transition from APO to its successor products IBP and S/4HANA.
What is not clear is the migration path with respect to industry solutions such as automotive, mill, cable. The assumption is that they will be migrated to relevant space. Cable solution which utilizes combination of ATP and PPDS will move to SAP S/4HANNA ATP and PPDS  space.

IBP Demand Planning

Firstly IBP demand planning is about excel therefore good-bye SAP GUI.
The demand planning tool exploits excel via SAP provided add-on for excel providing user maximum flexibility to adapt data to different planning conditions.


This implies usability is based on excel plus additional features that are possible such as setting graphs and the way data is presented .  Furthermore it does not need complex macro as per APO DP to manage cell;  changes , color,  text size.  Via excel  EPM formatting cells can be formatted to choose desired purpose so that changes are highlighted differ colors, borders, text size.
Within the same view alerts are automatically shown in different colours controlled by user and not back office.
Apart from excel user will access SAP Fiori; 

HTML5 based access via web browser and is technological adaptive to different dives, laptop, tablet , smart phone . Via controlled authorization user will access IBP SAP Fiori for loading data, deciding on forecasting techniques (algorithms) , set up promotional planning data and viewing analytics.
Furthermore via SAP JAM used for collaboration,  IBP for demand will be totally integrated so that different teams can progress in efficient manner the demand management process; historical data review and cleansing, forecasting review, consensus, market review.  The total integration allows for predefined planning view structured for relevant teams without wasting time in creating data view. Example ; for consensus planning there will be a planning view  structured specifically product family, market and in desired time buckets.
Apart from usability, flexibility in viewing data in within different versions, planning in different versions user totally independent from back office and system is highly adaptive to user needs.
ID Demand also has major improvement offering new forecasting algorithms,  furthermore forecasting model can have multiple algorithms associated so that best fit solution can be determined with a view in maximizing forecast accuracy.
ID demand also offers scenario planning; planner can on the fly create a scenario for review with other teams which is then tailored/ modified and then accepted within baseline version.  This implies not only having multiple scenario; baseline, upside, downside but ability to create on the fly scenario (what if promotion lift due to marketing campaign) which are then reviewed with the collaboration tool.

Possible APO to IBP migration

So invested million in APO third party; what next ?
Incentive to migrate to IBP is the following:

  1. Current APO DP solution not providing real business benefits, poor forecast accuracy due to its design, usability, rigidity and lack of forecasting algorithms. 
  2.  End of APO support 2025. C
  3. Consolidate third party tool to IBP Demand Planning with a view exploiting IBP Demand , S&OP and Control Tower

Thursday, 28 March 2013

The mother of all KPI: THROUGHPUT

Generally most KPI are a waste of time and effort. Most are ‘so what’ KPI. They are isolated KPI that do not contribute to real business benefits. Some are mainly output related rather than throughput related; Example case is inventory versus throughput.


The key difference is that throughput is based on what is actually billed and delivered, while output is something produced and sitting in inventory providing zero value to the organization. Fundamentally throughput relates to cash flow, productivity and profitability; the key elements of any success factor of an organization.

Having throughput as a KPI measure provides the ability for any organization to achieve its goal; the goal of being profitable and ability to grow. The rest has no relevance.

Throughput also directly influence productivity, net-profit; all those fundamental elements that are critical to any organization but strangely never really measured correctly.

Measuring throughput on its own provides limited value without linkages to the organizational elements resources, markets, teams and process which are all part of the system. Throughput is the outcome of a system. System Thinking considerations:

• A system is greater than the sum of its parts

• A system is not the sum of its elements/parts – it is the sum of their interactions. IT interacts with other areas. In order to maximize manufacturing, the objective is not output but rather throughput (what is made and sold). The parts that interact can be the following:

    • Manufacturing Equipment, tooling
    • Skilled resources
    • Manufacturing execution system
    • Manufacturing planning and control system
    • Management structure
    • Policies

Fundamentally each one needs to consider how they interact with each other. The performance of the system depends on how well the parts fit together

Therefore to maximize throughput it is important to optimize the interaction between the various elements of the system.

Introducing multi-dimensional throughput KPI measurement , will ensure the visibility of direct contribution of related elements (the system) that have an impact on throughput:

  • Resources
    • Manufacturing Plants
    • Throughput for actual manufacturing site
    • Productivity for actual manufacturing site
    • Manufacturing equipment / System
    • Throughput for actual key constraining resources
  • Markets
    • Geographical area
    • Product Brands
    • Customer groups
    • Organizational Teams
  • Sales
    • Marketing
  •  Information Technology
    • Manufacturing
    • Supply Chain
    • Finance
  • Process
    • Design
    • Order
    • Make
    • Sell
Business Transformation projects sometimes fail because apart from change management there is no clear indication how it will contribute to real benefits; how will it contribute to increasing throughput.

Concepts:

• Throughput (T) is the rate at which the system produces "goal units." When the goal units are money (in for-profit businesses), throughput is net sales (S) less totally variable cost (TVC), generally the cost of the raw materials (T = S - TVC). Note that T only exists when there is a sale of the product or service. Producing materials that sit in a warehouse does not form part of throughput but rather investment. ("Throughput" is sometimes referred to as "throughput contribution" and has similarities to the concept of "contribution" in marginal costing which is sales revenues less "variable" costs - "variable" being defined according to the marginal costing philosophy.)

• Investment (I) is the money tied up in the system. This is money associated with inventory, machinery, buildings, and other assets and liabilities. In earlier Theory of Constraints (TOC) documentation, the "I" was interchanged between "inventory" and "investment." The preferred term is now only "investment." Note that TOC recommends inventory be valued strictly on totally variable cost associated with creating the inventory, not with additional cost allocations from overhead.

• Operating expense (OE) is the money the system spends in generating "goal units." For physical products, OE is all expenses except the cost of the raw materials. OE includes maintenance, utilities, rent, taxes and payroll.

Organizations that wish to increase their profitability should consider the following:

1. Increase throughput? How to increase, in what areas?

2. Reduce investment (inventory) (money that cannot be used)? How?

3. Reduce operating expense? How?

The answers to these questions determine the effect of proposed changes on system wide measurements:

1. Net profit (NP) = throughput - operating expense = T-OE

2. Return on investment (ROI) = net profit / investment = NP/I

3. TA Productivity = throughput / operating expense = T/OE

4. Investment turns (IT) = throughput / investment = T/I

Friday, 11 January 2013

Demand Management Effectiveness


In order to effectively design and implement APO Demand Planning any organization, it is important have a clear working framework. Critical aspect to consider is that Demand Management is an approximation; it is never a pure science. There is quite a difference between forecasting and Demand Planning, forecasting is a mathematical action while Demand Planning is a process where forecasting if part of the process.

The objective of this post is provide food for thought regarding the Demand Management process.

The key objective is to achieve an efficient Demand Management system that is user friendly ( different user profiles), has the required technical enablers (forecast procedure)  and is able to achieve primary objective of maximizing throughput of the organization taking into consideration business complexities:

• Supply chain pattern; make to order, make to stock, export markets, VMI, toll manufacturing, late pack customization  ect..

• Product life cycle

• Proliferation of products

• Different roles in the business impacting Demand Planning

SAP APO Demand Planning is one of the most un-structured solution in SAP; un-structured implies that the whole Demand Planning solution has to be built with the provided technical framework. It is purposely un-structured in that it has to be built to satisfy business requirements with respect to data views, data aggregation and data manipulation.

In order to effectively manage Demand Planning it is critical to understand the following:

• The technical framework provided by SAP DP

• Key elements in the technical framework provided by SAP DP

• The Demand Planning Process


DP TECHNICAL FRAMEWORK

This framework is provided SAP in the APO Demand Planning system


SAP Technical Framework

This framework is provided by SAP to build the DP solution and consists of:

  •  Planning Area where data is stored and manipulated
  • Planning book’s and data view; the user front end for managing Demand Planning. Characteristics and key figures. This is the most critical area for user management.
  •   Info Cube in the Data warehousing system needed for feeding data to the Demand Planning solution
The above must be specifically set-up to satisfy the business requirements and is supported by elements described below.

ELEMENTS IN THE FRAMEWORK

Within the framework there are additional elements provided by SAP DP framework, these are:
  • Macro’s for manipulating data and presenting data in user friendly-way (example red cell for exception )
  • Data aggregation management; critical for data viewing and data consistency
  • Standard forecasting models
  • Standard forecast error calculation formula
  • Tool-set for phase-in, phase-out, interchangeability
  • Characteristics based planning
  • Ability to upload data back to Data warehousing info cube
  • Ability to integrate Demand Planning data with other Supply Chain tools such as Supply network planning, production , Sales and Operations Planning
  • Authorization control
  • Exception and alert management
The above all play a critical role in setting up an effective Demand Management solution and need to be carefully addressed.

THE DEMAND PLANNING PROCESS

The Demand Planning in most cases consists of a number of steps, different resources, different data granularity for each process, business and supply chain constraints. Therefore critical to understand the process so that correct and effective Demand Planning framework can be set-up. In certain cases too much time is wasted in addressing a forecasting formula or forecast accuracy formula instead of understanding clearly the DP process. The understating of the process and exploiting the technical framework will ensure the correct level of user-friendliness and desired objective.

Demand Planning Process

The Demand Planning process consists of:

  • History Management or data preparation for actual forecasting process; preparing base data for forecasting
  •  The actual forecasting and forecasting review process
  • Consensus Management with different role players; marketing and sales , manufacturing to determine agreed final forecast with different business process owners.
  • Alert and exception management applicable to all three of the above processes to ensure more efficient data management. Critical for forecast accuracy, data manipulation (copying from one cell to another, mathematical calculation) and data presentation (red cell for phase-out period)
Furthermore the process is controlled / constrained by organization procedure (monthly forecasting) , market behaviors and supply chain patterns.
The process is also managed by different resource that require unique data granularity; consensus forecasting with sales and marketing require data to be aggregated by brand, my markets, channel ect..
Understanding the above then determine how to exploit the provided framework.

HISTORY MANAGEMENT PROCESS

The purpose of history management is to provide clean base history data that will be the input to generating the statistical forecast. This is extremely critical, forecast calculation   and accuracy becomes irrelevant if you based data is not meaningful.
This data view must show current and prior year demand such as shipment, order , promotional data .

Example Data View

The data view must provide the level of detail needed to generate a fairly usable Adjusted History Base. Macro’s will help to identify outliers for user to understand how to address this aspect. Critical that user is able to view data by product grouping, brand, markets ect..The macro’s must also clearly provide exceptions allowing the user to prioritize their actions. Zero exception are also critical for user to analyses and understand.

Macro Cell Manipulation

This data view is one the most fundamental in that it provides the baseline data for statistical forecasting. Forecast formula’s , forecast accuracy formula’s all become irrelevant if the baseline is of little value.

STATISTICAL FORECAST MANAGEMENT

Forecasting is a mathematical activity which is part of the Demand Planning process.
The data view used for forecasting must contain all the required data to effectively manage the forecast by the planner. It must provide required key figures that are needed for the planner to have clear view on how the forecast should be managed.

Sample data view

It must clearly show how  forecast was determined and must provide all required data to manipulate and change forecast models and factors. It must also provide historical forecast accuracy performance data to indicate how well forecasting is progressing.

Std Forecast data
  • It must have historical data for comparison purposes
  • It must have forecast accuracy data to determine trends
  • It must have alerts to efficiently manage exceptions with respect to forecast accuracy , outliers ect..
  • It must allow focused data management; example flagging products that are phasing out and phasing in
  • Monitoring and managing alpha, beta and gamma 

Forecast Parameters


Alpha Factors
Beta Factors
Gamma Factors

The above is then critical for the user to review forecast results, carry-out the necessary changes such as changing the forecast model or factors.

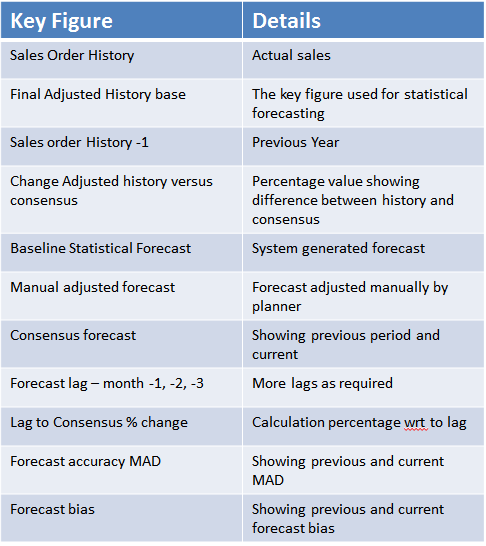
Additional key figures that show bias values are also critical. These can help focused data with alert threshold for planner to rapidly review forecast data.

Forecast Accuracy Key Figure

CONSENSUS FORECASTING PROCESS

Once forecasting is completed, there is normally some form of consensus forecasting done with other entities like sales and marketing , production.
This is critical to ensure alignment with sales and marketing , alignment with production. It is no use having forecast that cannot be satisfied by production resources, or demand that is not aligned with promotions/campaigns.
Data aggregation is critical when reviewing data with the specific business entity like marketing. Furthermore not only is data aggregation critical but also time disaggregation.


Example Data View

Depending on target for consensus review, it could be that both monthly and quarterly data buckets will be required:

Monthly View
Quarterly View

This is critical for data view and having data granularity to suit the end target.

The data must be specific and uncluttered with unnecessary data.

Data View

As shown above, focused data for marketing review, data aggregation of data is critical; example customer group, brand ect…, and must clearly control how data at lower level is re-determined.

Dissagregation

LEAN VIEWS:

Depending on target (maybe production), helpful to have multiple data view including lean views. Lean views mean that only have basic data containing limited key figures at aggregated view. Example would be reviewing data with marketing team, different data elements when reviewing data with manufacturing.


The above defines  the minimum data needed to review data with specific business entity.

ALERT MANAGEMENT

The Demand Planning process needs to be supported by robust alert and exception management to help relevant planner to address specific data results in order to be efficient considering the possible high data volume. It is critical that alert are process relevant to facilitate the applicable process.


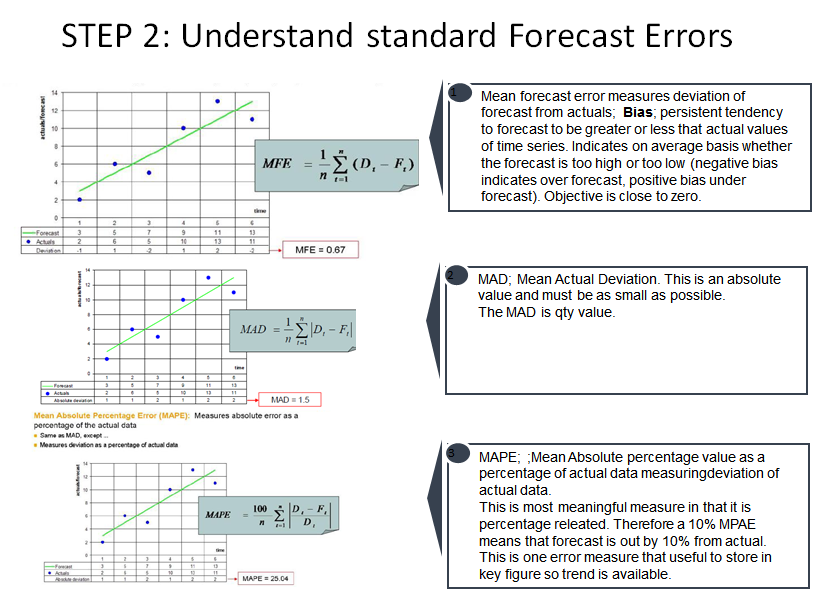
Macro’s play a key role in managing alerts in the relevant data view. Sometimes alerts have to redetermine certain forecast error calculation. Typical consideration:
The mean absolute percentage error (MAPE), also known as mean absolute percentage deviation (MAPD), is a measure of accuracy of a method for constructing fitted time series values in statistics, specifically in trend estimation usually expresses accuracy as a percentage, and is defined by the formula:


Although the concept of MAPE sounds very simple and convincing, it has a major drawbacks in practical application ; If there are zero values (which sometimes happens for example in demand series) there will be a division by zero. This is an area where a custom macro could help to build own logic. Note; SAP provides standard macro function, but nothing stops one from creating totally new function (custom function module) with own logic. 

Concluding remarks: The key around having Demand effectiveness that drives the Supply Chain is a well defined Demand Planning Process which results in meaningful product demand that not only will result in high level of forecast accuracy but must ensure required product availability across the supply chain demand elements. Forecasting is a sub-set of Demand Planning and has critical dependencies in order to generate meaningful  forecast.


Wednesday, 2 January 2013