Friday, 11 January 2013

Demand Management Effectiveness


In order to effectively design and implement APO Demand Planning any organization, it is important have a clear working framework. Critical aspect to consider is that Demand Management is an approximation; it is never a pure science. There is quite a difference between forecasting and Demand Planning, forecasting is a mathematical action while Demand Planning is a process where forecasting if part of the process.

The objective of this post is provide food for thought regarding the Demand Management process.

The key objective is to achieve an efficient Demand Management system that is user friendly ( different user profiles), has the required technical enablers (forecast procedure)  and is able to achieve primary objective of maximizing throughput of the organization taking into consideration business complexities:

• Supply chain pattern; make to order, make to stock, export markets, VMI, toll manufacturing, late pack customization  ect..

• Product life cycle

• Proliferation of products

• Different roles in the business impacting Demand Planning

SAP APO Demand Planning is one of the most un-structured solution in SAP; un-structured implies that the whole Demand Planning solution has to be built with the provided technical framework. It is purposely un-structured in that it has to be built to satisfy business requirements with respect to data views, data aggregation and data manipulation.

In order to effectively manage Demand Planning it is critical to understand the following:

• The technical framework provided by SAP DP

• Key elements in the technical framework provided by SAP DP

• The Demand Planning Process


DP TECHNICAL FRAMEWORK

This framework is provided SAP in the APO Demand Planning system


SAP Technical Framework

This framework is provided by SAP to build the DP solution and consists of:

  •  Planning Area where data is stored and manipulated
  • Planning book’s and data view; the user front end for managing Demand Planning. Characteristics and key figures. This is the most critical area for user management.
  •   Info Cube in the Data warehousing system needed for feeding data to the Demand Planning solution
The above must be specifically set-up to satisfy the business requirements and is supported by elements described below.

ELEMENTS IN THE FRAMEWORK

Within the framework there are additional elements provided by SAP DP framework, these are:
  • Macro’s for manipulating data and presenting data in user friendly-way (example red cell for exception )
  • Data aggregation management; critical for data viewing and data consistency
  • Standard forecasting models
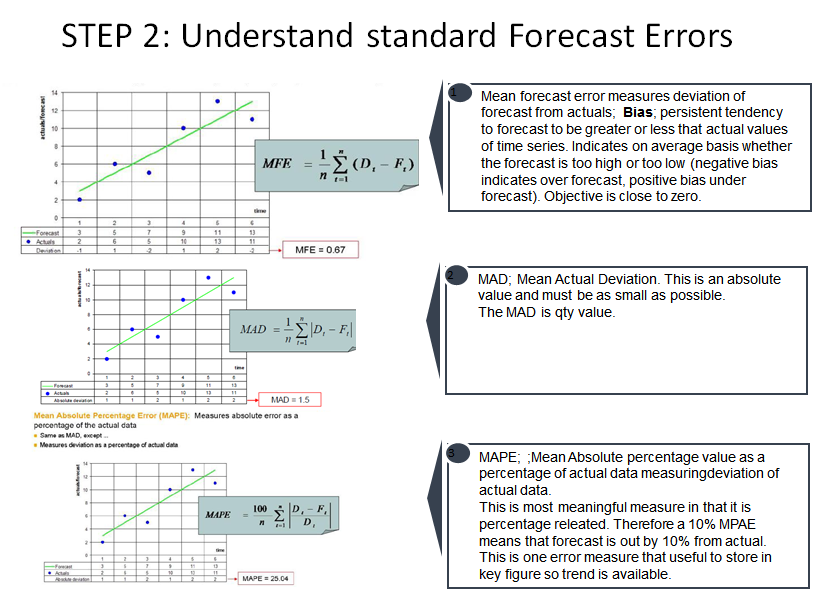
  • Standard forecast error calculation formula
  • Tool-set for phase-in, phase-out, interchangeability
  • Characteristics based planning
  • Ability to upload data back to Data warehousing info cube
  • Ability to integrate Demand Planning data with other Supply Chain tools such as Supply network planning, production , Sales and Operations Planning
  • Authorization control
  • Exception and alert management
The above all play a critical role in setting up an effective Demand Management solution and need to be carefully addressed.

THE DEMAND PLANNING PROCESS

The Demand Planning in most cases consists of a number of steps, different resources, different data granularity for each process, business and supply chain constraints. Therefore critical to understand the process so that correct and effective Demand Planning framework can be set-up. In certain cases too much time is wasted in addressing a forecasting formula or forecast accuracy formula instead of understanding clearly the DP process. The understating of the process and exploiting the technical framework will ensure the correct level of user-friendliness and desired objective.

Demand Planning Process

The Demand Planning process consists of:

  • History Management or data preparation for actual forecasting process; preparing base data for forecasting
  •  The actual forecasting and forecasting review process
  • Consensus Management with different role players; marketing and sales , manufacturing to determine agreed final forecast with different business process owners.
  • Alert and exception management applicable to all three of the above processes to ensure more efficient data management. Critical for forecast accuracy, data manipulation (copying from one cell to another, mathematical calculation) and data presentation (red cell for phase-out period)
Furthermore the process is controlled / constrained by organization procedure (monthly forecasting) , market behaviors and supply chain patterns.
The process is also managed by different resource that require unique data granularity; consensus forecasting with sales and marketing require data to be aggregated by brand, my markets, channel ect..
Understanding the above then determine how to exploit the provided framework.

HISTORY MANAGEMENT PROCESS

The purpose of history management is to provide clean base history data that will be the input to generating the statistical forecast. This is extremely critical, forecast calculation   and accuracy becomes irrelevant if you based data is not meaningful.
This data view must show current and prior year demand such as shipment, order , promotional data .

Example Data View

The data view must provide the level of detail needed to generate a fairly usable Adjusted History Base. Macro’s will help to identify outliers for user to understand how to address this aspect. Critical that user is able to view data by product grouping, brand, markets ect..The macro’s must also clearly provide exceptions allowing the user to prioritize their actions. Zero exception are also critical for user to analyses and understand.

Macro Cell Manipulation

This data view is one the most fundamental in that it provides the baseline data for statistical forecasting. Forecast formula’s , forecast accuracy formula’s all become irrelevant if the baseline is of little value.

STATISTICAL FORECAST MANAGEMENT

Forecasting is a mathematical activity which is part of the Demand Planning process.
The data view used for forecasting must contain all the required data to effectively manage the forecast by the planner. It must provide required key figures that are needed for the planner to have clear view on how the forecast should be managed.
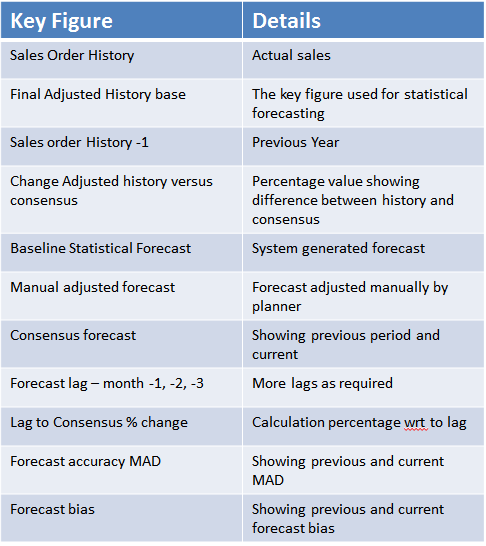
Sample data view

It must clearly show how  forecast was determined and must provide all required data to manipulate and change forecast models and factors. It must also provide historical forecast accuracy performance data to indicate how well forecasting is progressing.

Std Forecast data
  • It must have historical data for comparison purposes
  • It must have forecast accuracy data to determine trends
  • It must have alerts to efficiently manage exceptions with respect to forecast accuracy , outliers ect..
  • It must allow focused data management; example flagging products that are phasing out and phasing in
  • Monitoring and managing alpha, beta and gamma 

Forecast Parameters


Alpha Factors
Beta Factors
Gamma Factors

The above is then critical for the user to review forecast results, carry-out the necessary changes such as changing the forecast model or factors.

Additional key figures that show bias values are also critical. These can help focused data with alert threshold for planner to rapidly review forecast data.

Forecast Accuracy Key Figure

CONSENSUS FORECASTING PROCESS

Once forecasting is completed, there is normally some form of consensus forecasting done with other entities like sales and marketing , production.
This is critical to ensure alignment with sales and marketing , alignment with production. It is no use having forecast that cannot be satisfied by production resources, or demand that is not aligned with promotions/campaigns.
Data aggregation is critical when reviewing data with the specific business entity like marketing. Furthermore not only is data aggregation critical but also time disaggregation.


Example Data View

Depending on target for consensus review, it could be that both monthly and quarterly data buckets will be required:

Monthly View
Quarterly View

This is critical for data view and having data granularity to suit the end target.

The data must be specific and uncluttered with unnecessary data.

Data View

As shown above, focused data for marketing review, data aggregation of data is critical; example customer group, brand ect…, and must clearly control how data at lower level is re-determined.

Dissagregation

LEAN VIEWS:

Depending on target (maybe production), helpful to have multiple data view including lean views. Lean views mean that only have basic data containing limited key figures at aggregated view. Example would be reviewing data with marketing team, different data elements when reviewing data with manufacturing.


The above defines  the minimum data needed to review data with specific business entity.

ALERT MANAGEMENT

The Demand Planning process needs to be supported by robust alert and exception management to help relevant planner to address specific data results in order to be efficient considering the possible high data volume. It is critical that alert are process relevant to facilitate the applicable process.


Macro’s play a key role in managing alerts in the relevant data view. Sometimes alerts have to redetermine certain forecast error calculation. Typical consideration:
The mean absolute percentage error (MAPE), also known as mean absolute percentage deviation (MAPD), is a measure of accuracy of a method for constructing fitted time series values in statistics, specifically in trend estimation usually expresses accuracy as a percentage, and is defined by the formula:


Although the concept of MAPE sounds very simple and convincing, it has a major drawbacks in practical application ; If there are zero values (which sometimes happens for example in demand series) there will be a division by zero. This is an area where a custom macro could help to build own logic. Note; SAP provides standard macro function, but nothing stops one from creating totally new function (custom function module) with own logic. 

Concluding remarks: The key around having Demand effectiveness that drives the Supply Chain is a well defined Demand Planning Process which results in meaningful product demand that not only will result in high level of forecast accuracy but must ensure required product availability across the supply chain demand elements. Forecasting is a sub-set of Demand Planning and has critical dependencies in order to generate meaningful  forecast.


Wednesday, 2 January 2013

Friday, 25 May 2012

Production Optimization Versus Throughput Optimization — A Systematic Approach to Improving Production Effectiveness using TOC

A case study with respect to applying Theory of Constraints methodology in SAP enviroment.
Overview:
About TOC
About DBR
Case Study
SAP stuff; PPDS and PP
http://www.slideshare.net/bev41078/scmeu2012-villa-productionoptimization

Tuesday, 10 January 2012

Theory of Constraints (TOC) Overview: A SAP Approach

Key factors with respect to manufacturing are speed , reliability and capacity.


Manufacturing normally suffers from:
·   Poor on-time performance
·   Long production lead-times ; big batch sizes1
·   High WIP and/or finished goods inventory
·   High overtime due in-efficient labour utilization
·   Excessive expediting and rescheduling
·   Wandering or stationary bottlenecks
·   Inability to absorb additional market demand
The above deficiencies have a serious impact to a organization financial efficiency.

The Theory of Constraints maintains that every system is subject to at least one constraint, which prevents the system from achieving infinitely high levels of performance. In order to improve/optimize manufacturing efficiency the Drum, Buffer and Rope (DBR) concept will be applied to:

1.Increase Throughput ; throughput KPI = Sales - Material costs

2.Reducing Inventory ; raw materials , wip and finished products

3.Reducing operating expenses.

The above 3 critical KPI have a major impact on Productivit

Process and TOC focus.
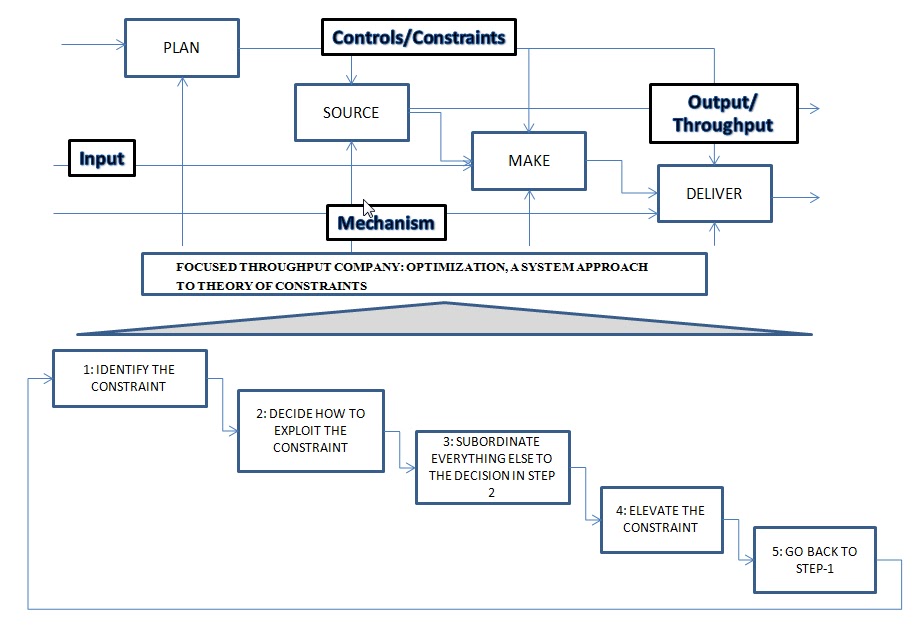
An organization  main processes are Plan, source,  make and deliver. Within these processes there are constraints that if not exploited or synchronized will impact productivity. This will be overcome by carrying out the following TOC steps.
Fundamentally Theory of Constraint is mainly a strategy/approach/technique to focus one attention to winning, maximize throughput resulting in higher productivity and profits. Focus on what is critical, the rest is secondary.
The key priorities to be managed:
1.       Throughput; ensure the highest possible throughput of the system
2.       Inventory reduction; ensure optimum level of raw materials and work-in process as well as finished products
3.       Operating expenses
The focus wrt of the various posts and specifically around exploiting SAP will be around throughput and inventory.
FIVE STEPS OF TOC
STEP 1: Indentify the constraint.
Find the one element of the manufacturing system which limits the system's ability to achieve its goal. In most manufacturing. Basically identify what limits the system performance.
Very important to consider that a process is governed by:
·              I Input ; components/raw materials
·              C control ; policy , methods , shift, set-up requirements; tooling
·              M Mechanism; the actual manufacturing machine that has a rated capacity
·              Output the manufactured item (semi or finished product)
Refer to: http://sapscminfo.blogspot.com/search/label/Optimization

System constraints can be either physical or policy. Physical constraints are relatively easy to identify and relatively straightforward to break. Policy constraints are usually more difficult to identify and break, but they normally result in a larger degree of system improvement that the elimination of a physical constraint
STEP 2: Decide how to exploit the constraint .
Once the constraining has being identified understand how to exploit the constraint, that means squeezing the most out of the manufacturing constraint in order to attain maximum performance. Therefore consider all aspect around the process:
· Policy and procedure
 Tooling, set-up equipment, set-up matrix
· Planning and execution system; ERP , APS ect...
This must be done without major system changes or capital improvements with the primary objective of eliminating inefficiency from the constraint
STEP 3: Subordinate everything else to the decision in step 2.
Take the required steps to synchronize and align the performance of all other elements with the "exploited" constraining element. This may mean slowing down "faster" parts and speeding up "slower" ones.. If you're constraint is broken at this point, go back to Step-1 and start looking for the next constraint (next weakest link in the chain). If not, go on to Step-4.
Fundamentally make effective management of the existing constraint the top priority
STEP 4: Elevate the Constraint.
If the constraining element still remains the reason why the system's performance "tops out"; then "Elevate" usually means doing something to increase the capacity of the constraining element. Obviously, if your constraining element is running at maximum efficiency (which it should be after Steps-2 & 3), the only way to improve overall system performance is to obtain more of the constraining element. In a manufacturing environment, this may mean a capital investment in more equipment, or hiring more people, or increasing work-ships.
STEP 5: Go back to STEP-1, but avoid "INERTIA".
This is the "repeat Steps 1-4" step. But the warning about "inertia" is important. It's designed to discourage complacency, thinking that the environment doesn't ever change much over time. Always consider that throughput increase can create other weaker links that previously were considered as secondary.
Subordinate everything else to the decision in step 2 based On Bottleneck Drummer
When it comes to subordinating everything to constraint, its bottleneck(s). In a production environment, the plant's constraint must be the driving factor in how it is managed. In production, the productivity of the constraint is the productivity of the entire plant.
A proven approach to managing production through the constraint is known as "Drum-Buffer-Rope" and "Buffer Management."
·   Drum - The constraint(s), linked to market demand, is the drumbeat for the entire plant.
·   Buffer - Time/inventory that ensures that the constraint(s) is protected from disturbances occurring in the system.
·   Rope - Material release is "tied" to the rate of the constraint(s).
The drum, buffer, and rope provide the basis for building a production schedule that is highly immune to disruption, avoids creating excess inventory, and uses small batches to minimize overall lead time.
But even with "Drum-Buffer-Rope," (DBR) occasionally disruptions occur that require special attention. "Buffer Management" is used to mitigate and often prevent those disruptions.
The DBR methodology is Theory of Constraints that will be used to maximize production throughput and inventory reduction based on the constraints (weakest link) being the DRUM, the BUFFER being the inventory needed for the constraint and the ROPE the timing for releasing the buffer with the main aim of protecting the weakest link an thus maximize thus overall effectiveness.
Benefits of TOC
The primary benefit of the TOC approach is its orientation toward the output of the entire system to maximize throughput (sales, billing), rather than a compartmentalized look at components which may have little or no positive effect on overall performance because of that "elephant in the parlor"--the system

Friday, 2 December 2011

Traceability in complex Supply Chain structure

Traceability within a Complex Supply Chain flow and Distributed System Architecture (multiple EWM systems) and multiple software platform (SAP ERP, TM, legacy ect…).
OVERVIEW:
Organization’s require traceability either due to legal requirements or due to quality control requirements.
Traceability normally consists of defining detailed characteristics of a handling Unit and it its product, batch characteristics (expiry date, certificate ect..) and as well tracking across their micro (within plant) and macro (extra plant) supply chain.
Furthermore, in most cases traceability data must be kept for a number of years and must be available even though data has being archived.  Further complexity is to be able to track within the pipeline based on specific characteristics such as batch number, mould number to determine its location and its association (production order, sales order )
Most organisations have complex supply chain flows, they can normally be within plant flow where batches / Handling units are received and processed across multiple steps. The characteristics of the batch and Handling unit may change as they are processed through various nodes of the supply network. Typical example would be temperature controlled items, expiry date ect…In this physical flow from a Micro physical flow.
Micro Flows
Furthermore, a Handling Unit can also be processed externally across multiple Supply Chain Units, across many organisations units such as other distribution centres, customer etc..as show in the macro physical flow.
Macro Flow Physical Flow
The above Supply Chain flows may also be supported by distributed IT network that are managed by  individual SAP systems such as ECC , EWM and TM systems as well as legacy system. In each of these system there are processes that are specific to their relevant supply chain and have to be tracked. There are further situation where macro flows jump from one system to the other. Typical example is a Handling Unit produced and processed in one plant that is manage in System X, it then is sent to another plant via ship, the shipping is managed by system Y and eventually received in relevant plant system Y.
These multiple system creates a traceability dilemma in that having a single point view with respect to traceability becomes a serious problem.  
Traceability update
This can be resolved with a centralized traceability system where its update is based on update rule from the various system. Update rule must contain the relevant event’s that should update the traceability system. This can be when a handling Unit is received from production, the traceability system will then be updated with the handling unit characteristics , its relevant status and its process status. An update rule could apply if handling blocked by quality department.
The ability of updating characteristics allows tracing of handling units based on characteristics of the Handling unit.  The traceability not only will provide a full history of its process events and the latest status.
SOLUTION
Having provided a view on Supply Chain complexity with respect to Traceability and technology elements that are present in a complex supply chain, the solution would be a single point of data storage and extraction (reporting). This can be done by using SAP BW  whereby traceability data is stored in relevant cubes and can be updated via updates rules from multiple systems.

 
The traceability system will be updated from the various system based on common updates rules defined for relevant process events that are critical for traceability.
The fundamental design requires two critical definitions:
  • The characteristics of the Handling Unit. In the definition of the characteristics it is imperative to define the critical key data elements that need to be maintained in the traceability. The data elements will be critical for tracking and reporting. From a reporting perspective data elements such as batch number, usability of the batch, tool number, certificate ect..This will then allow searching for related HU, example; search for usage of HU that was manufactured by a specific tool, or search all semi finished product HU where in put product was part of a specific batch.
  • The update rules that will update the characteristics; only key saupply process need to be controlled and updated in the traceability system. Typcial update rule if when HU is born, when received from production, when shipped out to another manufacturing plant.

The update of the centralized traceability system will then provide a central repository system that will contain complete flows thorough supply chain. This system will also provide status of each Handling unit and will allow the relevant user to take the required action should need arise due to specific requirement. Possible example relates to pharmaceutical environment where due a specific batch all Handling Units have to be traced through its pipeline. The traceability system will also provide a multi dimensional flow from raw materials, to semi-finished to completed manufactured item. This is critical should search  for a specific batch of a raw material right through its usage up their final state (finished product).

The above shows how  the traceability system is updated via the update rule as a Handling Unit is processed through the supply chain.
Although RFID system may provide this kind of traceability, it will still have a narrow views and will not have the flexibility of a custom traceability that one can define characteristic unique to one’s business.